
Condition Assessment Using Non Destructive Technique
| SR. No. | Location of Plant/ Name of Test | Rebound Hammer IS 13311 (Part-2)-1992 | USPV IS 13311 (Part-1)-1992 | Dye Penetration Test ASTM-E165 |
| Limit value/Parameters as per given Standards/codes | Average rebound number Quality of concrete Above 40 Very good layer, Between 30 and 40 Good layer, Between 20 to 30 Fair, Less than 20 Poor concrete, Less than 10 Delaminated | USPV by Cross Probing (km/sec)Above 4.5 – Excellent 3.5 – 4.5 – Good 3.0 – 3.5- Medium Below 3.0- Doubtful concrete Quality Grading as per IS 13311 (Part-1)-1992. | For defects like porosity cracks as per ASTM-E165.Also, Ferrous and Non-ferrous Metals as per ASME Sec-5, 2001; ASTM-E165 Flaws open to surface for the condition assessment of joints/welding/surface cracks | |
| 1 | Airport | Fair-Good Layer of concrete | Good-Medium | Acceptable |
SUMMARY REPORT BASED ON NON DESTRUCTIVE TESTING
Based on the Visual Inspection, NDT Result & Structure Analysis
- In order to assess the health assessment of the building, following test we conducted at site:-
- Ultrasonic Pulse Velocity Test as per IS: 13311 (Part-1)-1992 for ascertaining the quality of concrete, soundness and density of concrete. As per testing data the concrete is found in Good-Medium Range (3.46km/sec-4.34km/sec). There are indications absence of air-pockets and voids in structure from USPV test results as per IS:13311 part 1
- Rebound Hammer Test: For determining the estimated compressive strength of concrete and uniformity of concrete in terms of surface hardness as per IS 13311 (Part-2)-1992. As per testing results the average rebound value is 31 (M16 concrete grade as per correlation) concrete surfaces are not suffering from surface hardness problem. There is also no indication of blistering of concrete surface as per IS 13311 (Part-2)-1992.
- Structure Analysis: As per the structure analysis as per earthquake zone 4(IS 1893) under wind loading as per IS 875.
For Earthquake+ Wind Loading
| S.No | Particular | Remark | Reason |
| 1 | Steel hoarding members | UNSAFE | Grade is less than minimum need of IS-456 |
| 2 | Column | UNSAFE | Grade is less than minimum need of IS-456 |
| 3 | Foundation | UNSAFE | Grade is less than minimum need of IS-456 |
- INTRODUCTION
1. Introduction:
- Site
The existing structure HOARDING BOARD, AIRPORT has different height and different loading pattern in RCC+Steel frame structure. . This report pertains to the stated safety appraisal, health assessments. In this report first the description of the damage portions of the structure, objectives of the investigation and survey, general methodology and test procedures, etc. are given followed by details of the observations recorded at site and results of in-situ and laboratory tests.
1.2. Planning of Investigation and Methodology:
1.2.1 Walk over survey:
First and foremost activity in a condition survey and structural investigation, especially in distressed superstructure, is a walk over survey or systematic visual inspection so as to gather readily available information about the structure in question. Further, careful visual observation of typical crack pattern and the nature of the spalling can furnish valuable information regarding the distresses. This in turn provides an idea about the degree of damage encountered in the concrete and hence the extent of repair required. A systematic visual observation has been recorded in this investigation and the findings are presented in later part of this report.
1.2.2 Selection of tests:
Tests are selected on the basis of the requirements of the overall objectives of the investigation and the observations made during a quick walk over survey. In this investigation, following in-situ and laboratory tests were considered necessary for achieving the overall objectives stated earlier for the structure. Various Test were Conducted for the evaluation of the Structure:
The various Non-Destructive Tests proposed to be carried out for condition survey of the structure are listed below:
- Ultrasonic Pulse Velocity Test as per IS: 13311 (Part-1)-1992 for ascertaining the quality of concrete, soundness and density of concrete.
- Rebound Hammer Test: For determining the estimated compressive strength of concrete and uniformity of concrete in terms of surface hardness as per IS 13311 (Part-2)-1992.
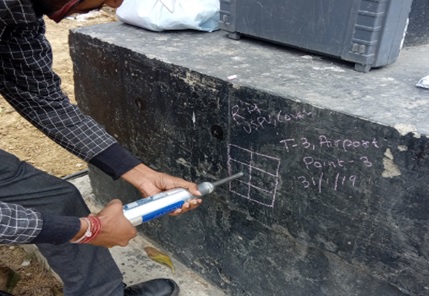
- Dye penetration test: – To check any surface defects over welds, covering HAZ (Hear Affected Zone) of all nozzles, manholes etc. For defects like porosity cracks as per ASTM-E165.Also, Ferrous and Non-ferrous Metals as per ASME Sec-5, 2001; ASTM-E165 Flaws open to surface for the condition assessment of joints/welding/surface cracks
- Methodology for performing various Non Destructive and Semi Destructive Tests
2.1 ULTRASONIC PULSE VELOCITY:-
Purpose:-
Although there is no fundamental relationship between pulse velocity and strength, an estimation of strength can be obtained by correlation. The method has perhaps a greater potential for comparing known sound concrete with affected concrete.
Ultrasonic pulse velocity is a means of assessing variations in the apparent strength of concrete.
The quality gradation of concrete can be appraised at best qualitatively as `excellent’, `good’, `medium’ or `doubtful’. The meanings of the term `excellent’, `good’, `medium’ and `doubtful’ are based on ultra sonic pulse velocity measured at site and are as per the nomenclature of IS 13311(part-1): 1992. To strike balance between the reliability, speed and damage to structure, core test have to be used to establish a correlation between rebound number index and the estimated in-situ strength with the USPV test results in the investigation.
Objective of testing:-
Ultrasonic pulse velocity test is used to establish the following:
- Homogeneity of concrete
- Presence of cracks voids, honeycombing and other imperfections
- Changes in the structure of concrete which may occur with time.
- Quality of one element of concrete in relation to another i.e. comparative quality analysis and gradation of concrete.
- The values of dynamic elastic modulus of the concrete.
References:-
- BS 6089:1981 and BS 1881:Part203
- IS 13311:Part1:1992
- ASTM: C597-83.
Influencing factors:-
The velocity of a pulse of ultrasonic energy in concrete is influenced by the stiffness and mechanical strength of the concrete
- Moisture content: The moisture content of the concrete have a small effect in the velocity and can increase the pulse velocity by 2%.
- Surface condition: The testing surface should be smooth any roughness cannot provide reliable readings because of gap between transducers and testing surface.
- Temperature: Ideal Temperature is between 50C and 300C; Temperature between 300C to 600C can reduce the pulse velocity up to 5%; below freezing temperature results in an increase the pulse velocity up to 7.5%.
- Stress: When concrete is subjected to a stress which is abnormally high for a quality of concrete, the pulse velocity may be reduced due to development of micro-cracks.
- Reinforcing bars: The velocity measured in reinforced concrete in the vicinity of reinforcing bars is usually higher than in plain concrete because pulse velocity in steel is 1.2-1.9 times the velocity in plain concrete. Wherever possible, measurements should be made in such a way that steel does not lie in the path of the pulse.
Testing method:-
According to IS 13311(Part1):1992 clause 5.2 transducers with a frequency of 50 to 60 kHz are useful for most all round applications, and as per IS 13311(Part1):1992 clause 6.2 the path length should be long enough not to be significantly influenced by the heterogeneous nature of concrete. This test requires a flat surface generally only appropriate for unspalled surfaces.
In view of inherent variability in the test results, sufficient number of readings should be taken by dividing the entire structure in suitable grid of markings 30×30 cm or even smaller. Each junction point of the grid becomes a point of observation.
There are three possible methods of testing according to the type of surface:
Table Velocity Criterion for Concrete Quality Grading [Ref: IS13311 (part-1)]
| Sr. No. | USPV by Cross Probing (km/sec) | Concrete Quality Grading. |
| 1 | Above 4.5 | Excellent |
| 2 | 3.5 – 4.5 | Good |
| 3 | 3.0 – 3.5 | Medium |
| 4 | Below 3.0 | * Doubtful |
2.2 REBOUND HAMMER TEST:-
Purpose:-
This test gives a measure of the surface hardness of the concrete surface. Although there is no direct relationship between this measurement of surface hardness and strength, an empirical relationship exists.
Rebound hammer is the best known methods of comparing the concrete in different parts of a structure and indirectly assessing concrete strength. The rebound hammer should be considered as a means of assessing variations of strength within a structure rather than an accurate means of assessing the strength.
Objective of testing:-
Rebound hammer test is performed to determine the following:
- Surface hardness
- Uniformity of concrete over the structure
- Grade of concrete
- Estimated strength which is derived from establishing a relationship between in-situ core strength and rebound number.
References:-
- BS 6089:1981 and BS 1881:Part 202,
- IS13311(Part2):1992
- ASTM C 805-02
Influencing factors:-
Rebound hammer test results are considerably influenced by these factors:
- Size, shape and rigidity of the specimen
- Age of test specimen
- Smoothness of surface and internal moisture condition of the concrete
- Carbonation of concrete surface
Testing Method:-
According to ASTM C 805-02 clause 7.1 the concrete members to be tested shall be at least 100mm thick and fixed within a structure. Towelled surfaces generally exhibit high rebound numbers than screed or formed finishes. Do not compare the test results if the form material against which the concrete is placed is not similar.
Heavily textured, soft or surfaces with loose mortar shall be ground flat with abrasive stone. Smooth formed or towelled surfaces do not have to be ground prior to testing.
Also this test is not conducted directly over the reinforcing bars having cover less than 20mm. The surface under test should be clean and smooth because rough surfaces cannot be tested as they do not give reliable results. Dirt or other loose material on the surface can be removed using a grinding stone prior to test.
2.3 DYE PENETRATION TEST
Purpose
This procedure is applicable for liquid penetrate examination of welds, heat affected zone and parent metal in ferrous metallic materials to detect discontinuities open to surface.
Objective
Dye penetration test is used to check the surface/welding cracks which are not visible from necked eye. It is the best recommended test when welding quality may not be followed during the construction.
Reference
- ASME B & PV CODE Section-V & Section-VIII
Influencing factors
- Surface Condition:
- Materials type
- Coating of material surfaces
- neither below 100 C (50o F) nor above 520 C (1250 F)
Testing Procedure
Surface Preparation
- The test surface shall be free from irregularities that could mask the indications due to discontinuities.
- The surface to be examined and all adjacent areas within at least 25mm shall be dry and free from dirt, grease, oil, scale or any other matter that could interface with the examination. Surface preparation may be done by brushing, grinding solvent cleaning etc.
- Cleaning solvent shall meet the requirement of clause 8.0.
- Drying of the surface to be examined shall be accomplished normal evaporation.
- A minimum time of two minutes shall be given for drying.
Colour contrast (visible) solvent removable penetrant with non-aqueous solvent suspended developer shall be used.
- a) Penetrant: Checkmate
- b) Solvent: Checkmate
- b) Developer: Checkmate
Penetrant shall be applied over examination surface by brushing or spraying. Penetrant shall be allowed to remain over test surface for at least 10 minutes (dwell time).After dwell time, the excess penetrant shall be removed by wiping with a lint free cloth, repeating the operation until most traces of penetrant have been removed. The remaining traces shall be removed by lightly wiping the surface with lint free cloth moistened with solvent. To minimize removal of penetrant from discontinuities, care shall be taken to avoid the excess use of solvent. Flushing the surface with solvent, following application of penetrant and prior to developing, is prohibited. The surface shall be dried by normal evaporation or wiping .Drying time shall not be less than 2 minutes.
Acceptance Standards
- Any relevant indication and all cracks
- Relevant rounded indications greater than 5mm.
- Four or more relevant rounded indications in a line separated by 1.5mm or less edge to edge.
3. NDT TEST RESULTS & INTERPRETATION
3.1 GENERAL INTRODUCTION
To assess the condition of concrete in terms of its existing quality and acceptability of its strength, the tests are usually chosen considering the economy, damage to structure, speed and reliability. Core tests provide the most reliable in-situ strength assessment, but causes damage to structure. The non-destructive tests (NDT) such as Ultrasonic Pulse Velocity test provide indirect measure of quality of concrete through specified indices namely, ultra sonic pulse velocity (USPV) respectively. In absence of such correlation, the concrete can be appraised at best qualitatively as `excellent’, `good’, `medium’ or `doubtful’. The meanings of the term `excellent’, `good’, `medium’ and `doubtful’ are based on ultra-sonic pulse velocity measured at site and are as per the nomenclature of IS 13311(part-1): 1992.
3.1.1Ultrasonic pulse velocity Test:-
USPV test makes possible the examination of homogeneity of material. Analysing the ultrasonic velocity wave propagation variations, it is possible to verify the compactness of the structure or detect heterogeneous regions. The ultrasonic test methodology in concrete is based on the fact that the propagation time expresses the density of the material. The main idea is to explore the fact that ultrasonic velocity waves are a function of the material density and quality of concrete based on density of existing concrete. USPV results also give idea about quality of original concrete (used in construction), air-pockets and voids as per IS 13311 (Part-1)-1992. We have converted indirect UPSV reading into equivalent direct proportionate USPV reading as per IS13311 part 1, Clause 5.4.1.Histogram of USPV test results is analysed in same pattern as rebound hammer is done but basic difference is that USPV results are interrelated in terms of density and rebound hammer results are interrelated in terms of surface hardness. Detailed density pattern of concrete in terms of USPV test results is given in the table .
| For USPV Test in Table | ||
| 6 | Type of surface | Possible methods of testing (Direct, Indirect & Semi Direct) |
| 7 | Distance (mm) | Distance between sonic transducer and receiver |
| 8 | Travel Time (µs) | Travelled time between transducer to receiver |
| 9 | Av. Velocity (km/sec) | Velocity of Ultrasonic Wave |
| 10 | Direct Proportionate Velocity | Direct Proportionate of Avg. Velocity (IS: 5.4.1 13311 part 1) |
| 11 | Concrete Quality | Velocity Criterion for Concrete Quality Grading as per IS 13311 (part-1)Table 2 |
3.1.2REBOUND HAMMER Test:-
Test results analysis of the Rebound Number values is based on test results conducted over concrete surfaces. Obtained test results explain about pattern of concrete quality of whole structure sections in terms of surface hardness. So there is no indication of blistering of concrete surface as per IS 13311 (Part-2)-1992. Estimated strength of concrete calculated from rebound hammer number is based on correlation graph between core strength v/s corresponding rebound hammer values. Rebound hammer has been carried out in all three directions horizontal, vertical down and vertical up. By using manufacturer graph, all vertical up/vertical down rebound hammer readings has been converted into the equivalent horizontal readings.Histogram plot of the Rebound Number values is based on test results conducted over concrete surfaces. Histogram plot explains about pattern of concrete quality of whole structure sections in terms of surface hardness. Rebound number helps to obtained Estimation of Strength of concrete from correlation between Rebound Hammer V/S Core Compressive strength. Estimated strength of concrete (obtained from correlation between Rebound Hammer V/S Core Compressive strength in table & fig ) is explained in the table
Figure
Reference for Test Certificate of Rebound hammer & Ultrasonic Pulse Velocity Test table
| For Rebound hammer Test | ||
| 1 | Sample Identification/Location | Location where test are conducted |
| 2 | Hammer Alignment | Direction of hammer |
| 3 | Rebound No. | Horizontal proportionate of rebound nos. from manufacturer calibration graph |
| 4 | Avg. Rebound No. | Rebound hammer no. obtained from instrument |
| 5 | Estimated Strength (MPa) | Correlation equation between RH and Core Value(ref equation figure 3.2) |
Test Certificate: – Rebound Hammer & Ultrasonic pulse velosity Test:-
| Quality Assurance in Concrete using Non Destructive Testing | ||||||||||||||||||
| Consultant :- O.B Developers | ||||||||||||||||||
| Quality Assurance in Concrete at T-3 IGI Airport , New Delhi | ||||||||||||||||||
| S. No./Location | Rebound Hammer Test | Ultrasonic Pulse Velocity | ||||||||||||||||
| SL. No. | Sample Identification/ Location | Hammer Alignment | Rebound No. | Avg. Rebound No. | Quality Of Concrete | Estimated Strength (MPa) | Type of surface | Distance (mm) | Travel Time (micro sec.) | Av. Velocity (km/sec) | Direct Proportionate Velocity (IS, 5.4.1 13311 part 1) | Concrete Quality | ||||||
| 1 | Point 1 | Pedestal | Horizontal | 28 | 30 | 30 | 32 | 30 | 28 | 30 | Fair | 15 | Indirect | 300 | 107.80 | 2.78 | 3.78 | Good |
| 2 | Base 1 | Horizontal | 32 | 32 | 30 | 32 | 28 | 30 | 31 | Good Layer | 16 | Indirect | 300 | 121.75 | 2.46 | 3.46 | Medium | |
| 3 | Base 2 | Horizontal | 26 | 28 | 26 | 28 | 28 | 28 | 27 | Fair | 13 | Indirect | 300 | 103.45 | 2.90 | 3.90 | Good | |
| 4 | Point 2 | Pedestal | Horizontal | 30 | 30 | 28 | 30 | 32 | 30 | 30 | Fair | 15 | Indirect | 300 | 94.40 | 3.18 | 4.18 | Good |
| 5 | Base 1 | Horizontal | 34 | 38 | 34 | 32 | 32 | 34 | 34 | Good Layer | 18 | Indirect | 300 | 89.71 | 3.34 | 4.34 | Good | |
| 6 | Base 2 | Horizontal | 32 | 32 | 34 | 32 | 32 | 32 | 32 | Good Layer | 17 | Indirect | 300 | 110.42 | 2.72 | 3.72 | Good | |
| 7 | Point 3 | Pedestal | Horizontal | 32 | 28 | 32 | 28 | 34 | 32 | 31 | Good Layer | 16 | Indirect | 300 | 95.60 | 3.14 | 4.14 | Good |
| 8 | Base 1 | Horizontal | 30 | 34 | 32 | 32 | 30 | 36 | 32 | Good Layer | 17 | Indirect | 300 | 91.10 | 3.29 | 4.29 | Good | |
| 9 | Base 2 | Horizontal | 32 | 32 | 32 | 30 | 32 | 38 | 33 | Good Layer | 17 | Indirect | 300 | 90.99 | 3.30 | 4.30 | Good | |
| Rebound Hammer(IS:13311 part 2):- Surface Hardness indices value should be more than 30 to get correlation with estimated strength , uniformity of concrete | ||||||||||||||||||
| USPV(IS:13311 part 1):- Concrete Quality Grading(km/sec) Above 4.5 – Excellent, 3.5 – 4.5 – Good , 3.0 – 3.5- Medium & Below 3.0- Doubtful |
| Average Rebound Number | Quality of Concrete |
| Above 40 | Very Good Layer |
| Between 30 to 40 | Good Layer |
| Between 20 to 30 | Fair |
| Less than 20 | Poor Concrete |
| Less than 10 | Delaminated |
- Analysis of uniformity and imperviousness of concrete on the basis of USPV test results:-
USPV makes possible an examination of material homogeneity. Analysing the ultrasonic velocity wave propagation variations, it is possible to verify the compact of the structure or detect heterogeneous regions. The ultrasonic test methodology in concrete is based on the fact that the propagation time expresses the density of the material. Histogram of USPV test results is analysed in same pattern as rebound hammer is done but basic difference is that USPV results are interrelated in terms of density and rebound hammer results are interrelated in terms of surface hardness. It has uniform concrete quality in terms of density. There are no indications of air-pockets and voids as significant from USPV test results as per IS:13311 part 1. Statistical data says that over all concrete has uniform grade of quality of density pattern.
As per testing data the concrete is found in Good-Excellent Range (3.46km/sec-4.34km/sec). There are indications absence of air-pockets and voids in structure from USPV test results as per IS:13311 part 1
- Interpretation of RCC Surface condition, uniformity of concrete and fck value of concrete obtained from Rebound hammer:-
Test results analysis of the Rebound Number values is based on test results conducted over concrete surfaces. Obtained test results explain about pattern of concrete quality of whole structure sections in terms of surface hardness.
As per testing results the average rebound value is 32 (M16 concrete grade as per correlation) concrete surfaces are suffering from surface hardness problem. There is also no indication of blistering of concrete surface as per IS 13311 (Part-2)-1992
3.2. DYE PENETRATION TEST:-
| DYE PENETRANT TESTING REPORT | |||||
| Inspection Agency:- OB Developers | Procedure No:-/FBD/DPE/R0 | ||||
| Job Description:- STRUCTURE WELDING | Job offer date:- 31.01.2019 | Test date:- 31.01.2019 | |||
| Mat. Type:-STEEL | Welding process:-NA | ||||
| Applicable Standard/Code:- AS PER ASME SEC V | Acceptance Criteria:- AWS D1.1 | Surface condition:- Rough | |||
| Stage of examination:- AS CAST | Surface Temp.:- Ambient | Type of Joint:- NA | |||
| Technique:- Solvent Removal | Method:-Visible | Basic Calibration:- Comparative Block | |||
| Lighting Equipment:- SUN LIGHT | Light Intensity:->1000 Lux | Post Cleaning:- Yes | |||
| CONSUMABLES & TESTING DETAILS | |||||
| Particulars | Brand Name | Type | Batch No. | Dwell Time/Drying time | |
| Penetrant | Magnaflux | SKL-SP1 | 16J13 | 15 Min. | |
| Developer | Magnaflux | SKD-S2 | 15E38 | 10 Min. | |
| Cleaner | Magnaflux | SKC-I | 16H01 | 2 Min. | |
| OBSERVATION | |||||
| S.NO. | IDENTIFICATION NO. | TYPE OF INDICATION | SIZE | RESULT |
| 1 | Point-1(Near Column-1) | NSD | – | ACCEPTABLE |
| 2 | Point-2(Near Column-1) | NSD | – | ACCEPTABLE |
| 3 | Point-3(Near Column-3) | NSD | – | ACCEPTABLE |
Annexure: – 1
Testing Photographs
C. TESTING PHOTOGRAPHS:-
Rebound Hammer Test
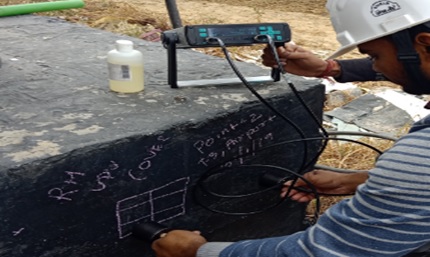
Ultrasonic Pulse Velocity Test
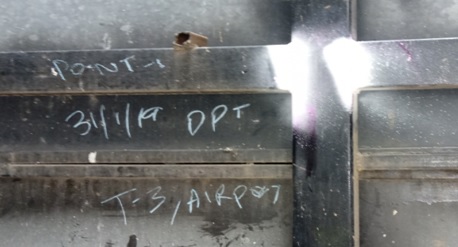
Dye Penetration Test
Structure Adequacy Analysis
- Introduction
The existing structure at HOARDING BOARD, TERMINAL-3, IGI AIRPORT, NEW DELHI is a single storied RCC+Steel framed structure. Timdaa has awarded the work to Wire Consultancy for conducting condition assessment of Steel Pre-Engineering framed structure.
This report pertains to the asserted safety appraisal and structural health assessments standards. In this report description of the damaged portions of the building, objectives of the investigation and survey, general methodology etc. are given, followed by details of the observations recorded at the site and results of visual inspection and staad analysis.
1.2 Scope of work and selection of tests
.
- Structure Analysis: To check the vulnerability analysis, structural deficiencies and structural stability analysis of overall structure, computer model of existing structure will be analyzed as per present loading criteria in Seismic Zone 4.
STRUCTURE ADEQUACY ANALYSIS
1. Method of structural adequacy analysis and design parameters:-
The seismic safety of a reinforced concrete building will depend upon the initial architectural and structural configuration of the total building, the quality of the Structural analysis, design and reinforcement detailing of the building frame to achieve stability of elements and their ductile performance under severe seismic lading. Proper quality of construction and stability of the infill walls and partitions are additional safety requirements of the structure as a whole. Any weakness left in the structure, whether in design or in construction will be fully revealed during the postulated maximum considered earthquake for the seismic zone 4 in the earthquake code IS: 1893.
Assumptions in static analysis
The basic assumptions in static analysis methodology are as follows:-
- The behavior of the structure is assumed to be perfectly linear and deformations are small
- All joints are rigid
- The members are subjected to axial, flexural and shear deformations
- The force deformation relationship remains linear during the entire load regime.
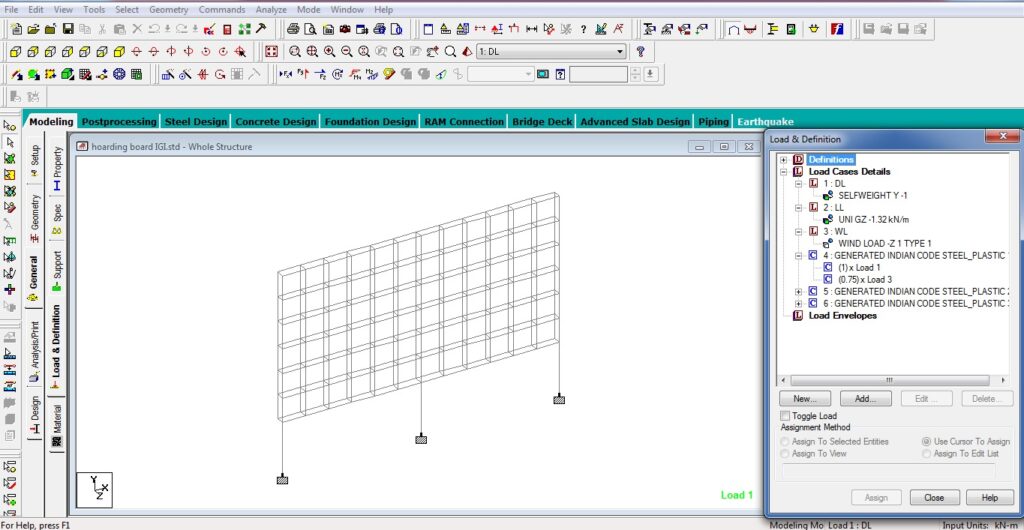
Mathematical Modeling
The structure is idolized as a 3-D space frame model. The beams and columns are considered as members. The floor slab load is given on beam members. The brick wall is used as a filler wall and is not casted monolithically with structure; hence this load is also given on beam members. The columns are assumed to be fixed at the foundation level.
2. Loads for Superstructure and Sub structural elements:
- Grade of Steel: 250N/mm2
- Density of Concrete: 24kN/m³
- Density of Steel: 78.5kN/m³
- Dead Load:
- Self-weight of members
- Weight of paints
- Wind Design Speed: 47 m/sec
3. Moments and Forces in Frame Element:
Calculate the moments and axial forces in the columns, shears and moments in the members by using an appropriate computer software. It may be performed by Static analysis.
4. Materials properties data for static analysis: (as given in test certificates of reports; clause no 4.1)
a) Steel : Grade of Steel: 250N/mm2
b) Unit weight of R.C.C : 25 kN/m3
c) P.C.C : nominal mix of 1:4:8
5. Load combinations
Combination of Loads considered in analysis: The structural design has been carried out in accordance with the provisions of the codes IS 456 – 2000 and IS 1893 – 2002 for Normal design conditions
Table of Load combinations and load factors as per (Ref. IS: 456 – 2000, CI.18.2.3.1, 36.4.1, and B4.3)
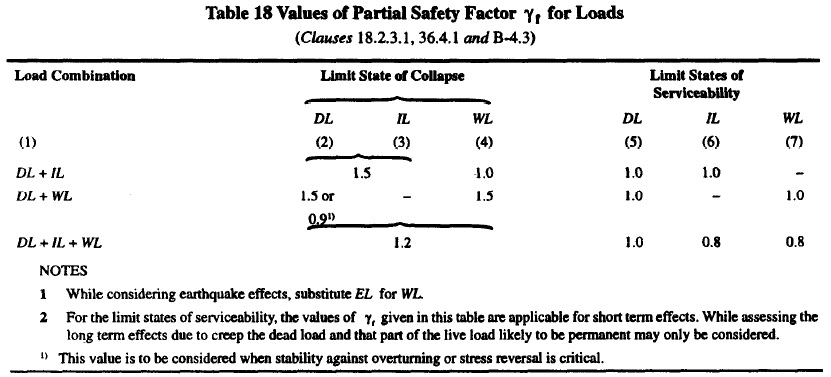
Note: DL = Dead Load, LL = Live Load/ Superimposed Load, WL = Wind Load, EL = Earthquake load
As per IS 1893 – 2002:-
Conclusion
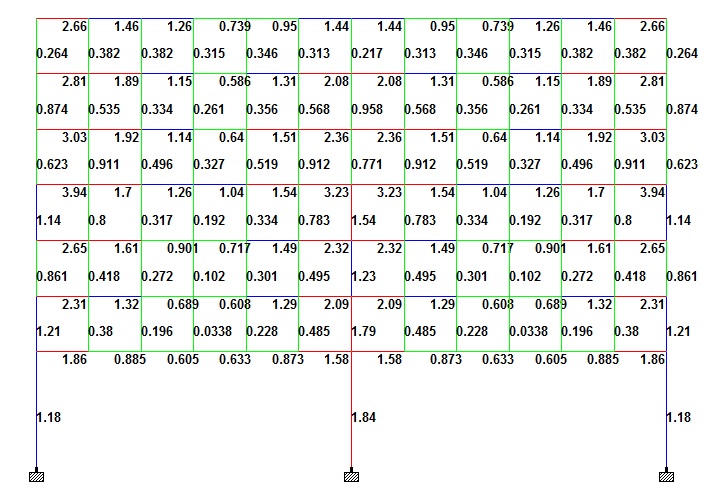
Note:- All the red marked members are getting failed during the wind analysis and design
Leave a Reply